
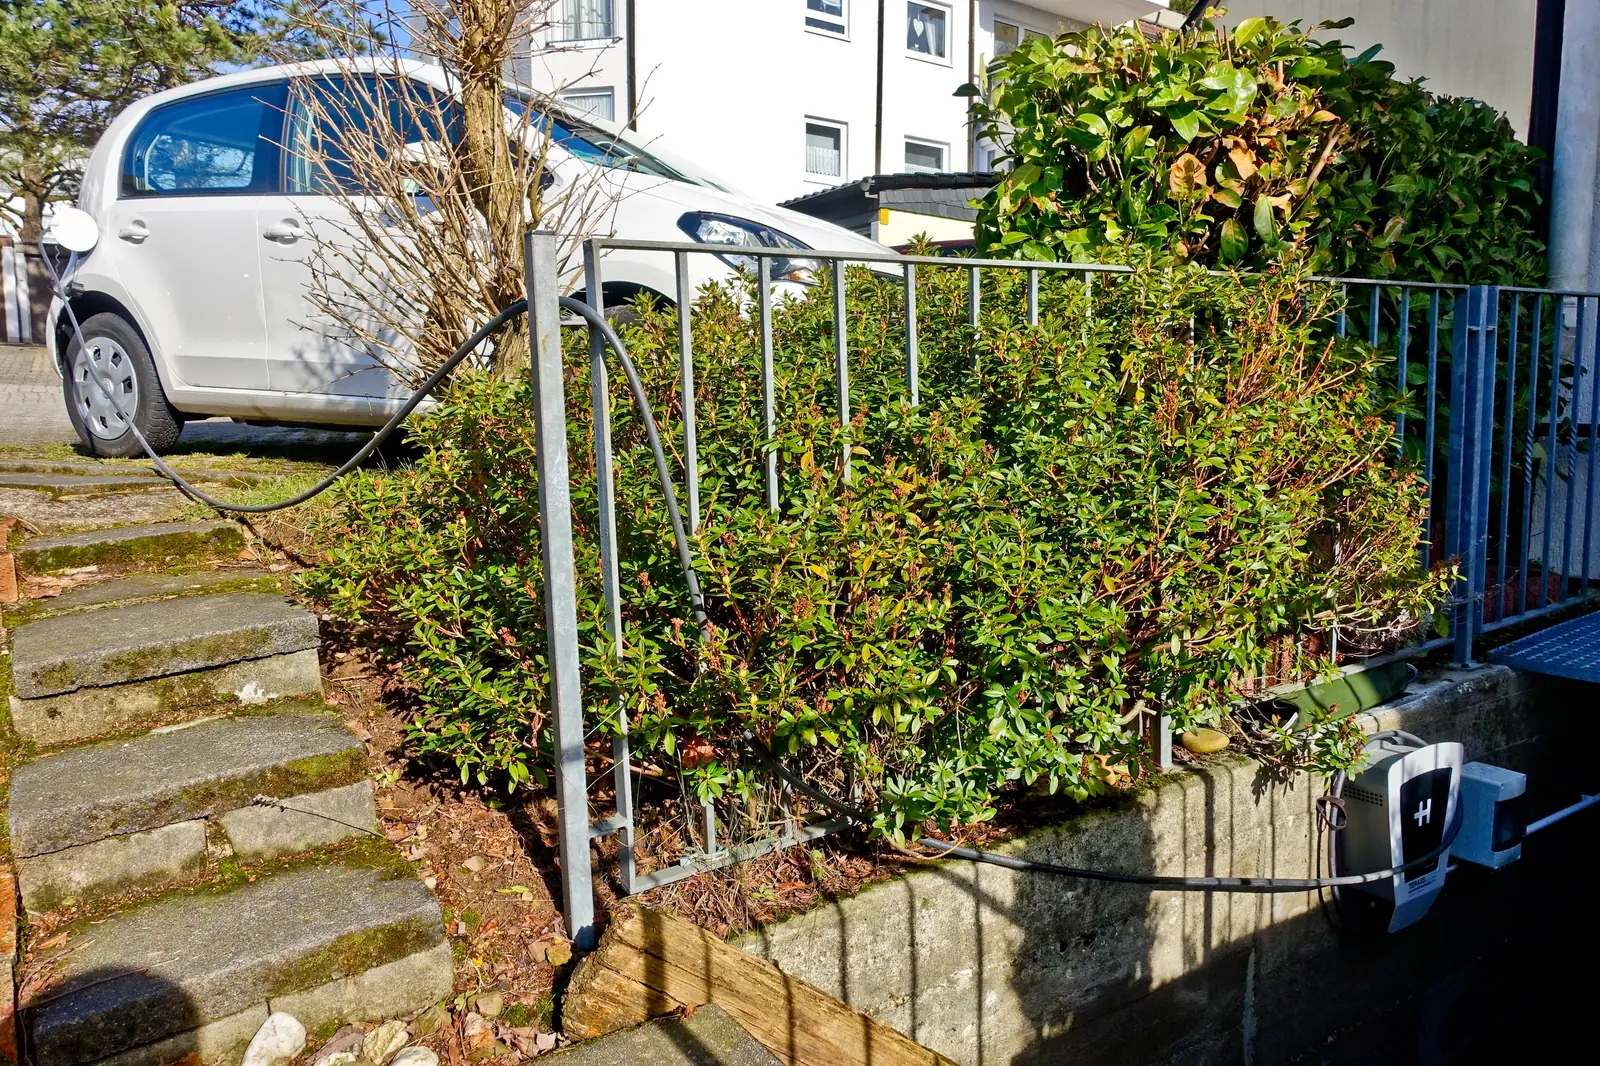
As of November 2026, the electricity you draw at a home wallbox or a household powerpoint is billed at the same retail tariff as the rest of the house. Using official 2026–27 default and standing-offer usage rates, and the method set out below, a typical mid-size electric car works out at about $4.50 to $7.60 per 100 km on a flat (anytime) tariff, or less if you can charge in a cheap overnight or midday window.
Those figures are incremental energy costs, including GST. They are not a quote for your bill. Tariffs vary by network, many households are on a market offer rather than the default or standing offer, and the rates below apply from 1 July 2026 to 30 June 2027 unless a regulator or government changes them sooner.
How much does it cost to charge an EV at home?
On the working assumptions in the next section — 16.5 kWh/100 km at the car, plus a 10% charging-loss assumption, so 18.15 kWh drawn from the wall per 100 km — official flat-rate usage charges for 2026–27 produce these illustrative costs:
- The lowest flat rates in this guide are Tasmania’s current residential flat tariff (Aurora Tariff 32, 24.75 c/kWh) at $4.49 per 100 km, or $539.05 a year at 12,000 km, and Victoria’s cheapest default flat rate (CitiPower, 25.96 c/kWh) at $4.71 per 100 km, or $565.41 a year.
- A mid-range example is the New South Wales Ausgrid default flat rate (33.14 c/kWh) at $6.01 per 100 km, or $721.79 a year.
- The highest flat rate among the official default and standing offers collected here is South Australia’s Default Market Offer cap (41.91 c/kWh) at $7.61 per 100 km, or $912.80 a year.
Charging in a cheaper window can cut those figures, sometimes sharply. It can also make things worse: on some time-of-use tariffs the overnight rate is higher than the flat rate. The state table and the off-peak section flag those cases.
Public charging is not priced in this guide.
How did we work out these charging costs?
Every dollar figure in the tables is a calculation from a published usage rate. Nothing is a retailer quote, and no rate has been invented.
Usage rates, including GST. For New South Wales, south-east Queensland and South Australia we used the residential Default Market Offer (DMO) usage caps for 2026–27 published by the Australian Energy Regulator, which apply from 1 July 2026 to 30 June 2027. For Victoria we used the Victorian Default Offer (VDO) domestic tariffs in the Essential Services Commission’s price determination for the same year. For Western Australia we used the regulated residential A1/A2 electricity charge published by Energy Policy WA (the same rate applies to small-use Synergy and Horizon Power customers under the Uniform Tariff Policy). For Tasmania we used Aurora Energy’s 2026–27 standing-offer prices as published by the Office of the Tasmanian Economic Regulator. For the ACT we used ActewAGL’s regulated Home standing-offer prices from 1 July 2026, which ActewAGL states are consistent with the Independent Competition and Regulatory Commission’s 2026–27 decision. For the Northern Territory we used Jacana Energy’s Standard Residential rates, which Jacana says are set under the Territory’s electricity pricing order and apply from 1 July 2026 to 30 June 2027. For regional Queensland we used Ergon Energy Retail’s published Tariff 11 and time-of-use rates from 1 July 2026, which match the Queensland Competition Authority’s notified prices once GST is added.
These default and standing-offer rates are safety-net or comparison prices. Many customers pay a different market offer. Compare plans on Energy Made Easy (including New South Wales, Queensland, South Australia, the ACT and Tasmania) or Victorian Energy Compare in Victoria, and check Synergy, Horizon Power or Jacana Energy if you are outside those markets.
Consumption. We used a working figure of 16.5 kWh per 100 km at the vehicle, inside a stated range of 15–18 kWh/100 km. That range is grounded in official laboratory figures on the Australian Government’s Green Vehicle Guide: as checked on 13 November 2026, 2026 Tesla Model Y variants are listed at 144–162 Wh/km (14.4–16.2 kWh/100 km) on the WLTP (4-phase) test where a cycle is named, and the 2025 BYD Sealion 7 Premium is listed at 170 Wh/km (17.0 kWh/100 km). The Guide itself says actual energy use depends on how you drive. Highway work, cold weather, a heavier vehicle or a less efficient model can sit above 18 kWh/100 km; a small, efficient car on a gentle commute can sit below 15. The 16.5 kWh figure is a mid-range working assumption, not a claim about every EV.
Charging losses. The car’s kWh/100 km figure is energy used at the vehicle. Some energy is lost as heat in the charger, cable and onboard charger. We have added 10% to convert vehicle use into energy drawn from the wall, and we label that 10% as an assumption, not a measured official factor. On that basis, 16.5 kWh at the car becomes 18.15 kWh from the wall per 100 km. If your charger or climate makes losses higher or lower, scale the dollar figures in line with the wall energy you actually use.
Annual kilometres. Annual costs are shown for 12,000 km. That is a rounded working assumption, not a current official average. The Australian Bureau of Statistics’ Survey of Motor Vehicle Use, which has ceased, found that passenger vehicles travelled an average of 11,100 km in the 12 months ended 30 June 2020, a COVID-affected and bushfire-affected year, down from 12,600 km in 2018. The Green Vehicle Guide’s own annual fuel-cost estimates use 14,000 km. Your cost scales in a straight line with kilometres: at 15,000 km, multiply the annual figures by 15,000 / 12,000, or 1.25.
The arithmetic. Cost per 100 km = 18.15 kWh × usage rate (cents per kWh) ÷ 100, in dollars. Cost per year at 12,000 km = that amount × 120, which is the same as 2,178 kWh × the usage rate ÷ 100. Figures are rounded to the nearest cent. To see the effect of the 15–18 kWh range, an Ausgrid flat rate of 33.14 c/kWh would be $5.47 per 100 km at 15 kWh plus 10% losses, or $6.56 per 100 km at 18 kWh plus 10% losses, before rounding of the annual total.
What is left out. Daily supply charges are not added to the charging cost, because a household already paying for electricity pays that fixed charge whether or not a car is plugged in (see below). Concessions, controlled-load metering fees, demand charges and solar feed-in credits are not built into the table. No public-charger prices are used.
What does home charging cost in each state and territory?
Rates and calculations are as of November 2026, for the 2026–27 tariff year (1 July 2026 to 30 June 2027). Usage rates include GST. Dollar figures use 18.15 kWh from the wall per 100 km and 12,000 km a year, as above.
| State / territory | Offer used | Flat rate (c/kWh) | Flat: per 100 km / year | Cheaper regulated window (if verified) | Window rate (c/kWh) | Window: per 100 km / year |
|---|---|---|---|---|---|---|
| NSW — Ausgrid (Sydney, Central Coast, Hunter) | AER DMO residential | 33.14 | $6.01 / $721.79 | DMO time-of-use, 9pm–3pm | 24.04 | $4.36 / $523.59 |
| NSW — Endeavour (western Sydney, Illawarra, Southern Highlands) | AER DMO residential | 33.73 | $6.12 / $734.64 | DMO time-of-use, 10am–2pm (overnight 8pm–10am is 35.69 c, higher than flat) | 12.35 | $2.24 / $268.98 |
| NSW — Essential (regional NSW) | AER DMO residential | 35.01 | $6.35 / $762.52 | DMO time-of-use, 10pm–7am (and 10am–3pm) | 24.15 | $4.38 / $525.99 |
| Victoria (five networks) | ESC VDO domestic | 25.96–31.98 | $4.71–$5.80 / $565.41–$696.52 | VDO time-of-use off-peak, 9pm–11am; cheaper still in the 11am–4pm solar-soak window (16.59–17.65 c, $3.01–$3.20 / $361.33–$384.42) | 21.17–22.60 | $3.84–$4.10 / $461.08–$492.23 |
| Queensland — Energex (south-east) | AER DMO residential | 27.97 | $5.08 / $609.19 | DMO time-of-use, 9pm–11am; 11am–4pm is much cheaper at 6.98 c ($1.27 / $152.02) | 25.30 | $4.59 / $551.03 |
| Queensland — Ergon (regional) | Ergon / QCA Tariff 11 and 12D | 28.895 | $5.24 / $629.33 | Tariff 12D night, 9pm–11am; Tariff 31 economy (if a dedicated circuit is installed for the charger) is 16.663 c ($3.02 / $362.92) | 25.044 | $4.55 / $545.46 |
| South Australia | AER DMO, SA Power Networks | 41.91 | $7.61 / $912.80 | DMO time-of-use, midnight–6am | 32.55 | $5.91 / $708.94 |
| Western Australia | Synergy / Horizon regulated A1/A2 | 33.2621 | $6.04 / $724.45 | A time-of-use or EV add-on may be available; official 2026–27 cents-per-kWh rates for those products were not verified from an accessible official page for this guide | — | — |
| Tasmania | Aurora standing offer, Tariff 32 (current flat) | 24.75 | $4.49 / $539.05 | Tariff 93 time-of-use off-peak (overnight, middle of weekdays, and all weekend; peak windows differ in daylight time) | 17.02 | $3.09 / $370.70 |
| ACT | ActewAGL Home standing offer | 36.9536 | $6.71 / $804.85 | Home time-of-use off-peak, 10pm–7am (AEST). Home Daytime Economy is 17.60 c from 11am–3pm ($3.19 / $383.33). Controlled Load Night, where eligible for EV charging, is 27.775 c ($5.04 / $604.94) | 29.92 | $5.43 / $651.66 |
| Northern Territory | Jacana Standard Residential | 31.6788 | $5.75 / $689.96 | Jacana time-of-use is cheaper only 9am–3pm (25.8294 c). At all other times it is 33.2165 c, higher than the flat rate | 25.8294 | $4.69 / $562.56 |
Victorian flat rates, from lowest to highest, are CitiPower 25.96 c, United Energy 27.35 c, Jemena 27.47 c, Powercor 28.22 c and AusNet Services 31.98 c per kWh. The off-peak and solar-soak ranges above use the same five networks.
Tasmania’s older Tariff 31 (27.9538 c/kWh, or $5.07 per 100 km / $608.83 a year on our assumptions) remains available to customers already on it, and to people who move into a premises still assigned to it, but OTTER says it is no longer available to new connections. Tariff 32 is the current residential flat rate.
Daily supply charges (including GST) on the same offers, for context only, include about $1.66 a day on Ausgrid’s DMO flat cap, $1.85 on Endeavour, $2.72 on Essential, $1.19–$1.38 on the Victorian Default Offer, $1.92 on Energex, $1.80508 on Ergon Tariff 11, $1.80 on SA Power Networks, $1.1924 on the WA A1 tariff, $1.82 on Aurora Tariff 32, $1.3420 on ActewAGL Home, and $0.6245 on Jacana Standard Residential. These amounts are already on a household electricity bill and are not added to the charging costs above.
We first published a Victoria-focused explainer in October 2026, which stays live and includes a petrol comparison: How much does it cost to charge an EV at home? The 2026–27 numbers, state by state. This guide covers every state and territory with a stated method, including regional Queensland and Tasmania’s current Tariff 32.
When is off-peak or an EV plan cheaper than a flat rate?
Often, but not automatically, and not always overnight.
In Victoria, the default time-of-use off-peak window (9pm to 11am) is cheaper than the flat rate on every network, and the 11am–4pm solar-soak rate is cheaper again. In New South Wales, Ausgrid’s default time-of-use rate from 9pm to 3pm (24.04 c) undercuts the 33.14 c flat rate, and Essential Energy’s 10pm–7am rate (24.15 c) undercuts its 35.01 c flat rate. Aurora’s Tariff 93 off-peak rate (17.02 c) is well below Tariff 32. ActewAGL’s overnight off-peak (29.92 c) is below the Home flat rate, and its midday Home Daytime Economy window (17.60 c, 11am–3pm) is lower still.
Two important exceptions sit in the table. On Endeavour Energy’s default time-of-use cap, the 8pm–10am rate (35.69 c) is higher than the 33.73 c flat rate; the cheap window published on the AER’s DMO page is 10am–2pm at 12.35 c/kWh. In the Northern Territory, Jacana’s time-of-use rate is cheaper only between 9am and 3pm; at night it is dearer than the standard flat tariff. If you only charge after dinner, those time-of-use offers can cost more than staying on the flat rate.
Retailers also sell market offers aimed at EV charging, often with a low overnight rate, a low midday rate, or a controlled-load rate for a dedicated charger circuit. Those offers change, and the cents-per-kWh rate usually depends on your network and postcode. We have not put an individual market-offer rate into the table, because a figure we cannot pin to a named plan, network area and date from an accessible official page would be a guess. Energy Made Easy and Victorian Energy Compare are the places to compare what is actually available at your address. A cheap overnight rate only helps if the rest of the household’s usage in expensive peak windows does not cancel the saving.
The AER’s Solar Sharer Offer, described on the Default Market Offer page, is an opt-in standing offer for residential customers with smart meters in DMO areas, with a free period of 11am–2pm in New South Wales and south-east Queensland, and 12pm–3pm in South Australia. Ergon Energy also publishes a Solar Sharer (Tariff 12F) with a zero-rate window from 11am–2pm for the first 24 kWh. Those free windows are useful if the car is at home in the middle of the day; usage outside the window is charged at the plan’s other rates, which can be higher than a simple flat tariff.
Do I need to add the daily supply charge?
Not to the incremental cost of charging the car, if the house already has an electricity account. The supply charge is a fixed daily amount for being connected. Plugging in an EV does not, by itself, add another supply charge.
It still matters when you compare plans. Some time-of-use or EV plans have a higher daily supply charge than a simple flat plan. If the higher supply charge outweighs the cheaper charging rate, the household bill can go up even if the car is cheaper to top up. Work the comparison on the whole bill, including household usage, not only on cents per kilowatt-hour for the car.
A dedicated controlled-load or economy circuit for a wallbox (for example Ergon Tariff 31 or 33, or ActewAGL Controlled Load Night, both of which list EV charging among eligible uses) may involve electrician work and, in Ergon’s case, a published one-off connection charge. Those installation costs are outside the energy table above.
Can solar cut the cost of charging at home?
Yes, if you can charge while your panels are generating, and if that electricity would otherwise have been exported or unused. The relevant comparison is then usually the value of the feed-in tariff you give up, or zero if the extra solar would have been clipped, not the retail usage rate in the table.
Official regulated feed-in examples checked for this guide include Tasmania’s 2026–27 regulated feed-in tariff of 9.276 c/kWh excluding GST, and Jacana Energy’s anytime solar feed-in tariff of 9.33 c/kWh. Both are well below the corresponding flat usage rates, which is why self-consumption is usually worth more than exporting and then buying the power back at night. Feed-in rates differ by retailer, contract and jurisdiction, and some are time-varying. This is not a full solar payback calculator, and it is not advice to oversize a system only for a car.
Households without rooftop solar can still use the cheap midday windows on solar-soak, Solar Sharer or similar tariffs where those are offered. You do not need panels to be assigned to those tariffs, but you do need to be able to charge during the cheap hours, which usually means a smart meter and a car that is at home in the middle of the day.
When do these electricity prices change?
In the National Electricity Market jurisdictions covered by the DMO and the VDO, the default prices are reset annually and take effect on 1 July. The 2026–27 DMO and VDO prices are locked in until 30 June 2027, according to the AER and the ESC. Western Australia’s regulated residential tariffs are reviewed in the State Budget and, in the figures used here, also changed on 1 July 2026. Tasmania, the ACT and the Northern Territory likewise published 2026–27 standing-offer or pricing-order rates from 1 July 2026.
Market offers can change at other times, subject to the notice rules in your contract. If you are reading this after 1 July 2027, treat every cents-per-kWh figure in this guide as historical and check the current determination or your retailer’s schedule. Network areas also matter: a “New South Wales” or “Victorian” average hides several distributors, and the wrong row will give you the wrong number.
Frequently asked questions
Is the default or standing offer the price I actually pay?
Only if you are on that offer. The DMO, VDO and other standing offers exist as a safety net and as a comparison price. The AER notes that most households are on a market offer, not the DMO. Your bill, or a comparison on Energy Made Easy or Victorian Energy Compare, is the way to see what you pay now.
How do I tell which electricity network I am on?
The distributor (Ausgrid, CitiPower, Ergon Energy Network, and so on) is named on your electricity bill. In Victoria it determines which VDO column applies; in New South Wales and south-east Queensland it determines which DMO cap applies. The retailer is the company that sends the bill and can be different from the distributor.
How much electricity does an electric car really use?
Use the official Green Vehicle Guide figure for your exact variant as a starting point, then allow for real-world driving and charging losses. The 16.5 kWh/100 km working figure plus a 10% loss assumption is a mid-range illustration. A large electric SUV on the highway in winter will use more; a small car in mild suburban traffic may use less. The trip computer and, after a few weeks, your electricity bill are the best check.
Should I charge overnight or in the middle of the day?
It depends on the tariff in front of you, not on a national rule. Overnight is cheaper on many time-of-use plans, including the Victorian default off-peak window and several DMO and standing-offer off-peak windows. Midday is cheaper — sometimes dramatically — on solar-soak, Solar Sharer and similar tariffs, and is usually the better time if you are using your own rooftop solar. On Endeavour’s default time-of-use cap and on Jacana’s time-of-use tariff, overnight charging is not the cheap option. Set the car or wallbox timer to the cheap window on your plan, and avoid the late-afternoon peak where that peak is expensive.
Does installing a wallbox change the electricity rate?
Not by itself. A wallbox is just the charging equipment. You still pay your retail usage rate for the energy it draws, unless you also switch to a different tariff or connect the charger to a controlled-load or economy circuit that has its own rate. A wallbox does make it easier to schedule charging, and some EV or controlled-load offers require a dedicated circuit or a smart meter.
Are public charging prices included in these figures?
No. This guide is only about electricity billed on a home (or other residential) retail tariff. Public AC and DC charger prices are set by charging networks and site hosts, vary widely, and have not been sourced or quoted here.
How do I scale the figures if I drive a different distance?
Multiply the “per 100 km” figure by your annual kilometres, then divide by 100. At 8,000 km a year the annual cost is two-thirds of the 12,000 km figure; at 20,000 km it is two-thirds higher. If your wall energy is 20 kWh/100 km rather than 18.15, multiply the dollar figures by 20 ÷ 18.15.
Will these numbers still be right next year?
The method will still be right. The cents-per-kWh rates will change. Default and standing-offer tariffs in the jurisdictions covered here are reviewed for 1 July each year. Recalculate with the new official usage rate, or with the rate on your own bill, using the same formula.
Sources
Cents-per-kWh figures are from official regulator, government or retailer pages accessed on 13 November 2026. Dollar figures are EV Select calculations using the method above. No individual market-offer rate is used in the table.
- Australian Energy Regulator, Default Market Offer 2026–27: https://www.aer.gov.au/industry/retail/default-market-offer
- Essential Services Commission, Victorian Default Offer 2026–27: https://www.esc.vic.gov.au/electricity-and-gas/prices-tariffs-and-benchmarks/victorian-default-offer and the Price Determination PDF
- Energy Policy WA, household electricity pricing: https://www.wa.gov.au/organisation/energy-policy-wa/household-electricity-pricing
- Office of the Tasmanian Economic Regulator, current regulated prices: https://www.economicregulator.tas.gov.au/for-customers/current-regulated-prices
- ActewAGL, ACT standard plan electricity prices from 1 July 2026: schedule of charges (PDF)
- Jacana Energy, residential pricing: https://www.jacanaenergy.com.au/residential/pricing
- Ergon Energy Retail, residential tariffs from 1 July 2026: https://www.ergon.com.au/retail/residential/tariffs-and-prices/residential-tariffs
- Queensland Competition Authority, regulated retail electricity prices 2026–27 (verification of Ergon GST-inclusive rates): project page
- Green Vehicle Guide (consumption range): https://greenvehicleguide.gov.au/
- ABS, Survey of Motor Vehicle Use, year ended 30 June 2020: https://www.abs.gov.au/statistics/industry/tourism-and-transport/survey-motor-vehicle-use-australia/latest-release
- Energy Made Easy: https://www.energymadeeasy.gov.au/ and Victorian Energy Compare: https://compare.energy.vic.gov.au/
- EV Select, Victoria-focused explainer (22 October 2026): https://evselect.com.au/articles/cost-to-charge-ev-at-home-victoria-2026